SubQuery Digs Into The Parachain Auction Data
A huge milestone has just been achieved for Polkadot, the completion of the first round of the parachain auctions. Over the past weeks we’ve observed a heated fight for the Polkadot crown, the first parachain slot, between Moonbeam and Acala. After a tightly fought race the winner of the auction was revealed to be Acala, if you want to learn more about how winners are selected in this modern candlestick auction then take a look at Dan Reecer’s (from Acala) excellent summary.
SubQuery is Polkadot’s leading data indexing service, and over the past week we’ve been powering millions of daily requests to the majority of the crowdloan dashboards, contribution apps, and analytics websites. Teams like SubVis, Parallel Finance, and DotMarketCap rely on SubQuery to provide real time data on the crowdloans and other on-chain data directly to their websites and apps.
Today we are going to explore a little more about what happened within the first auction by diving into the data behind every single contribution.
Firstly, from the launch of the first crowdloan to the close of the first auction (a little over 13 days), over 87.5 million DOT was contributed across all crowdloans by just under 68,000 addresses. Essentially 68,000 addresses worked together over 187,000 contributions to raise and commit over US$3.54 billion in 2 weeks. That’s a phenomenal amount by any standard, and a huge indication of how committed individuals (and entities) are to locking up their DOT for up to 2 years to support their favourite networks. The committed capital equates to almost 10% of Polkadot’s entire circulating supply.
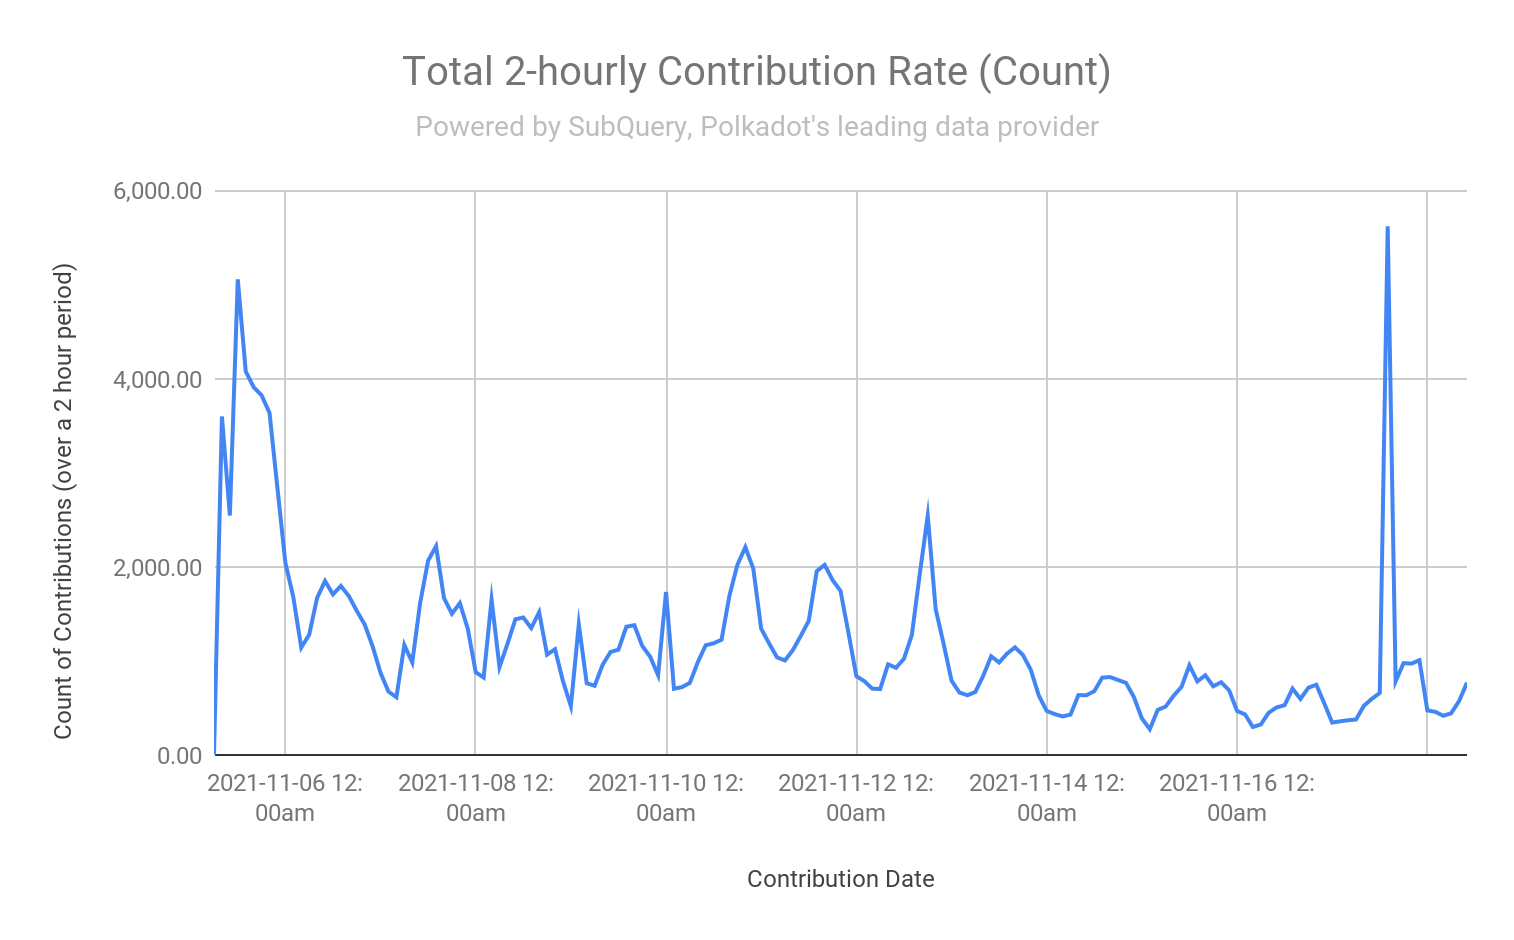
Investor interest really boomed in the start of the auctions, with a surge of contributions (by count) for the first few hours and also right towards the end before close. The first day of the crowdloans saw over 34,000 contributions and the last minute rush returned with 5,618 contributions in a 2 hour period.
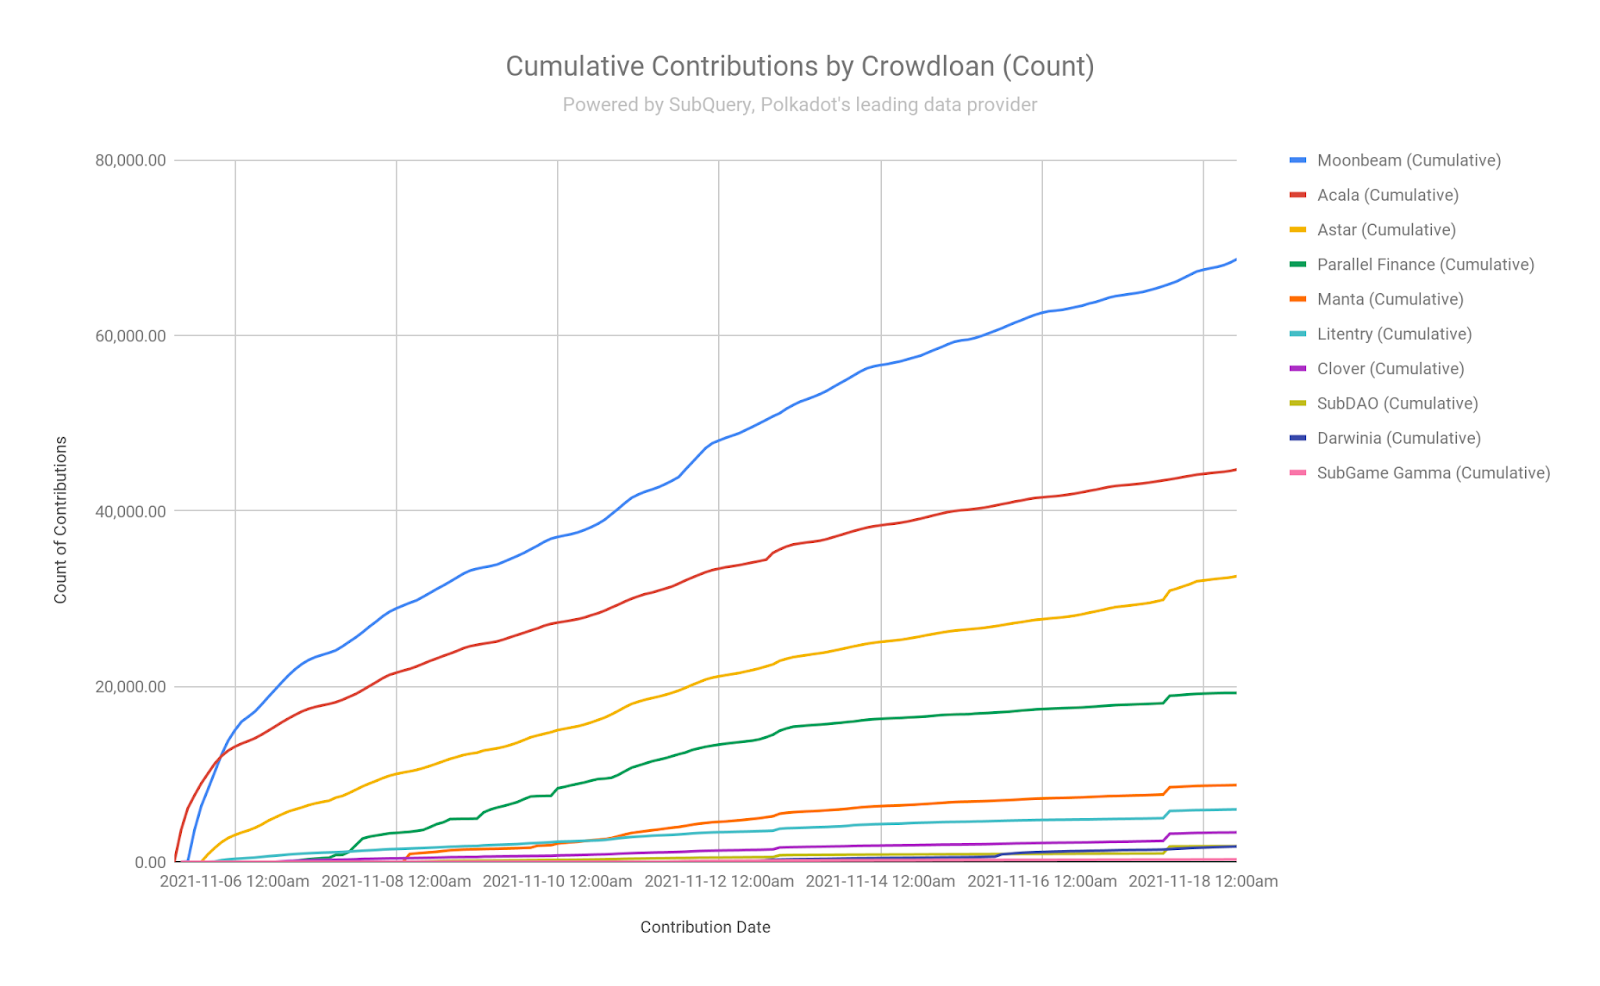
As you can see in the graph below, Moonbeam had by far the largest number of contributions throughout the auction, attracting almost 23,984 contributions from more than 21,333 more unique addresses than Acala.
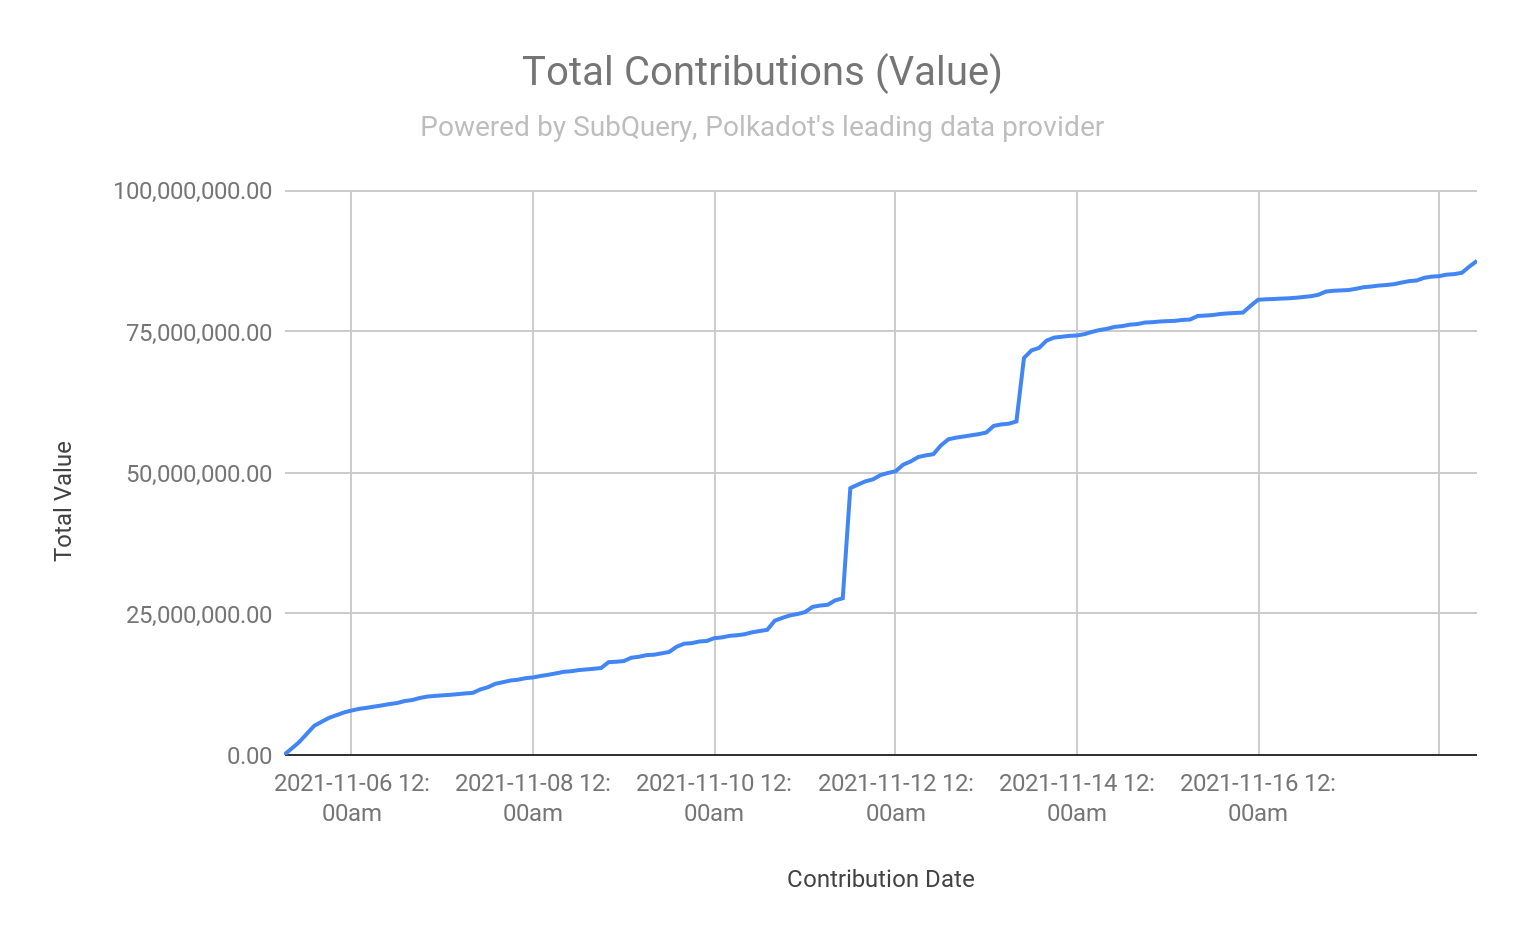
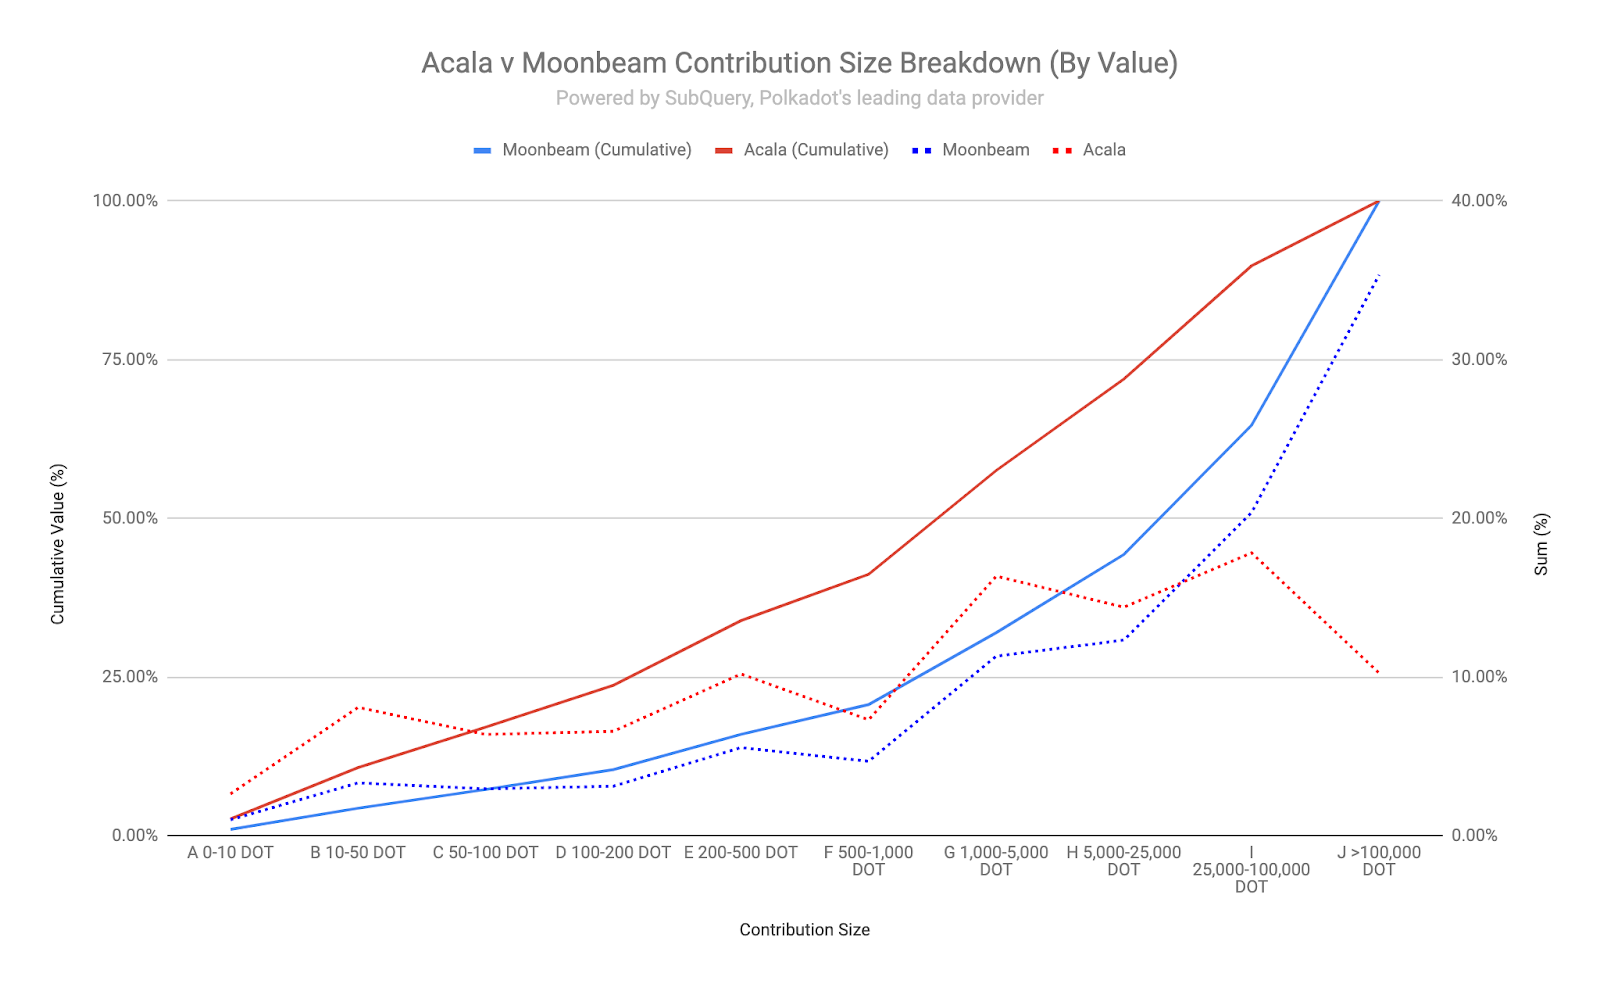
Acala obviously came ahead as the winner, so how did this happen? The number of contributors and their contributions hides the fact that Acala’s contributors on average contributed far more than Moonbeam. As a result the total contributions in terms of value looked like the graph below where Acala were slightly ahead of Moonbeam throughout the auction.
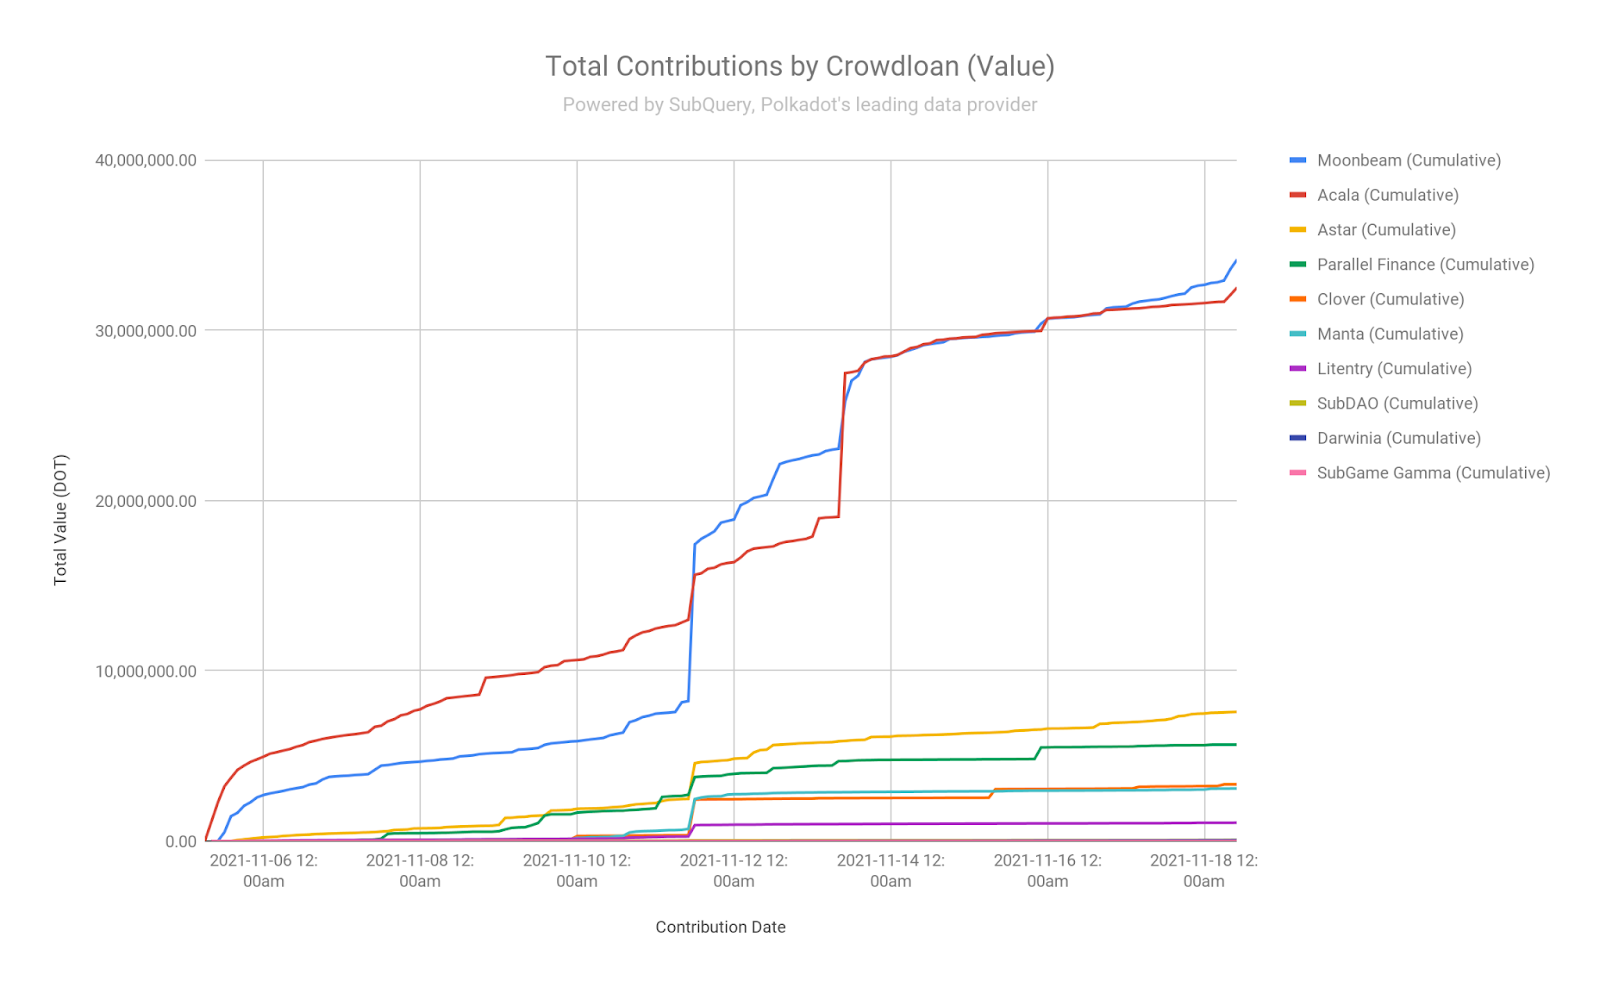
The majority of contributions by value occurred in two individual events, these two significant events essentially changed the outcome of the first auction.
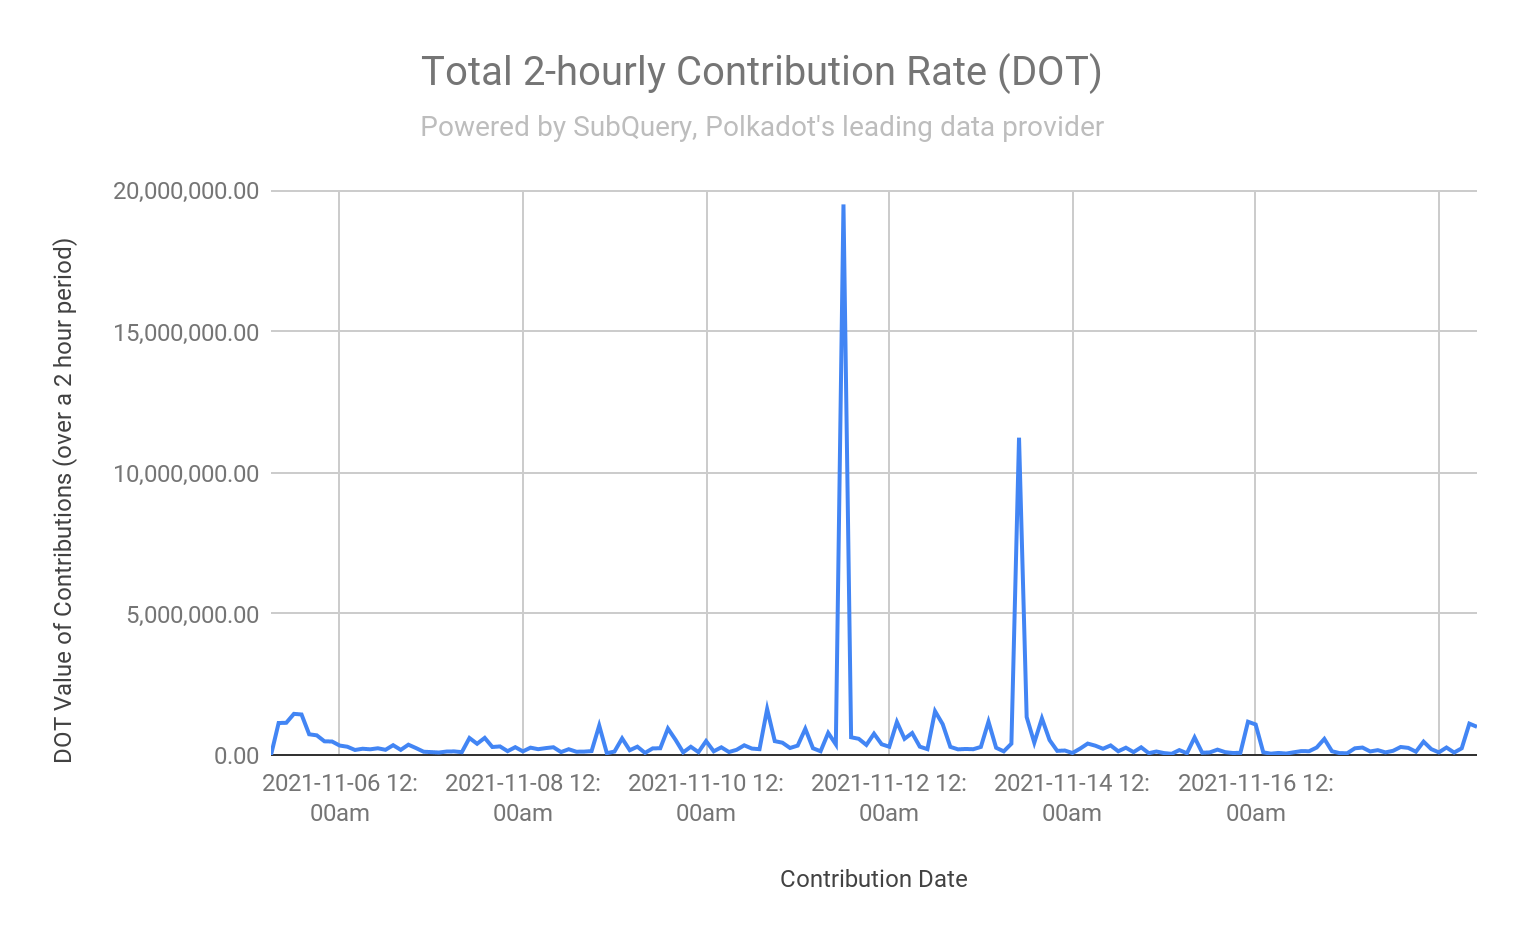
The first occurred in the space of 5 minutes starting at 1:25pm UTC on the 11th of November. A single address that we have linked to Binance’s Crowdloan address made a series of 7 transactions with a total value of over 19 million DOT (US$768.9 million). The first was the largest single contribution to Moonbeam with over 9 million DOT (US$364 million), followed by 6 other contributions on average 34 seconds apart. This address also made significant contributions to Acala (2.6 million DOT), Clover (2.1 million DOT), Astar (2 million DOT), and Manta (1.7 million DOT).
The second significant event occurred in the space of 75 minutes from 10.40am on the 13th of November when a single account made multiple significant contributions to Acala. This account represents Acala’s LCDOT address and was Acala deploying all of its liquid staked DOT to its crowdloan. First were some test transactions, then some major transactions which include the largest of 5.5 million DOT (USD$222.5 million). In the end Acala’s LCDOT fund made 3758 contributions over the auction.
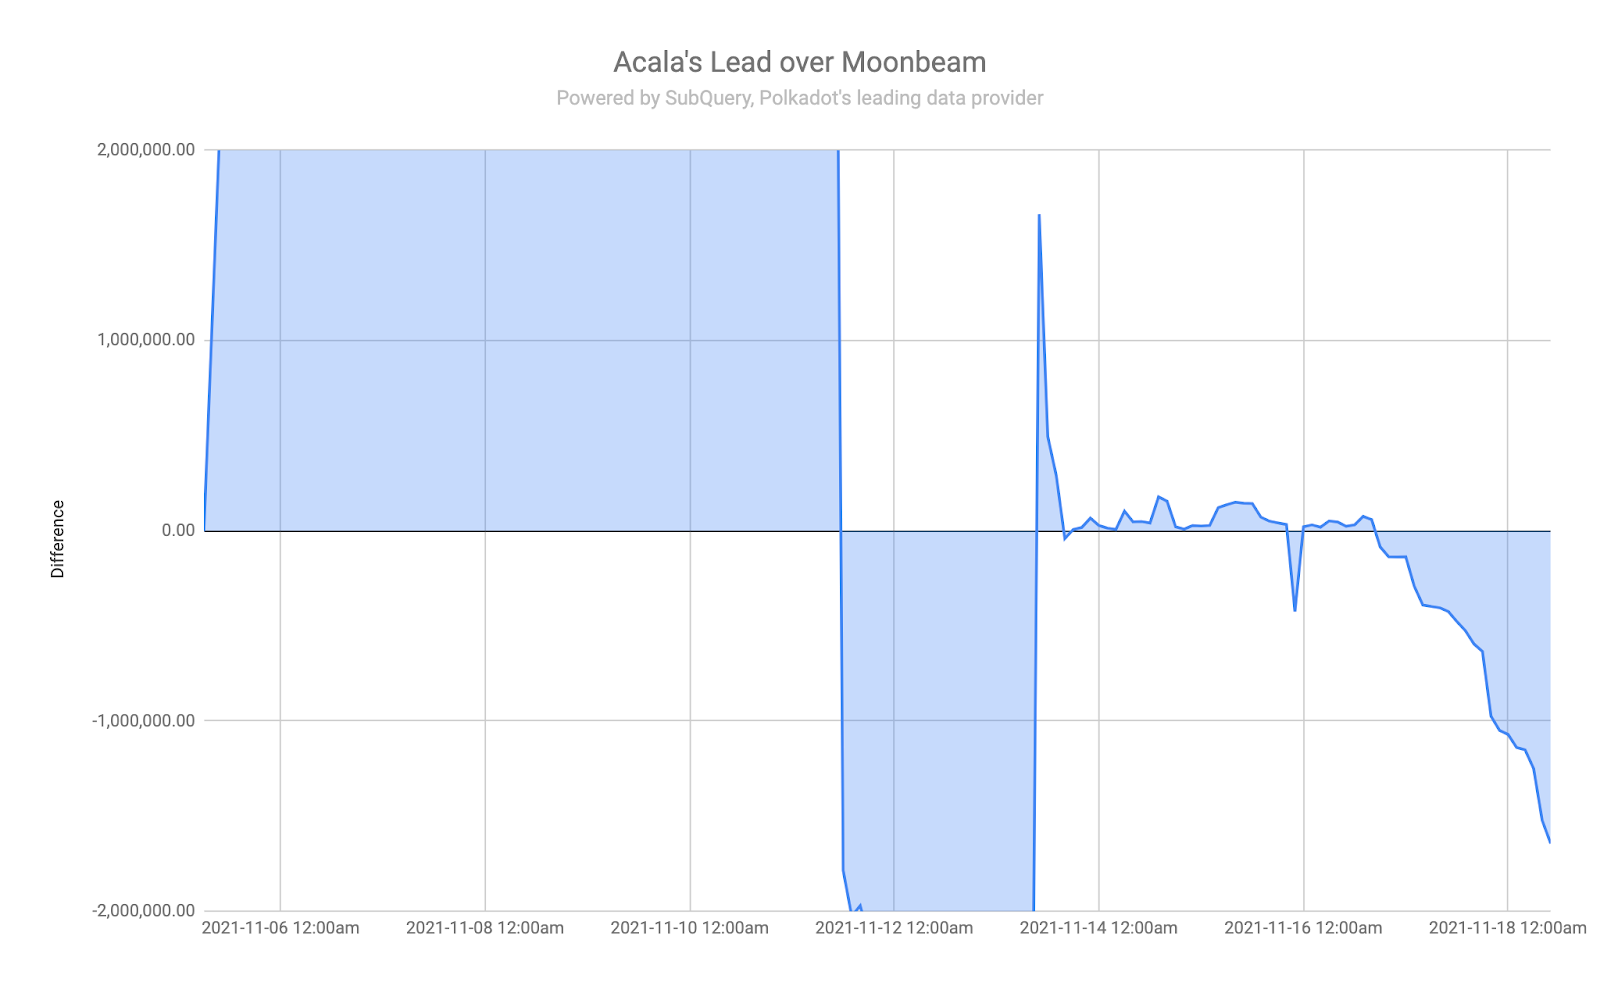
These series of transactions were ultimately able to push Acala above Moonbeam, and provide Acala with a winning percentage of 63.11% of the blocks. When the random winning block was selected ~56 hours later at block 7,718,090, Acala was ahead of Moonbeam by just ~38,000 DOT (USD$1.5 million).
One of the amazing things about these auctions, is that even after raising over 66 million DOT (USD$2.67 billion) between Acala and Moonbeam, the winning margin at the randomly selected block was just 0.056% of the total amount.
So who was contributing to the crowdloans? Firstly, the median amount contributed by all was just 12 DOT (USD$485.64), 47% of all contributions were less than 10 DOT and 88% were less than 100 DOT (US$4,047.00). This clearly demonstrates an extremely strong and robust community of individual contributors, testament to the retail interest in the parachain auctions.
The big question on everyone’s mind is who’s the people’s network? Which network has the largest proportion of small contributors? For the following insights into contribution size breakdown we have excluded some known exchange or crowdloan accounts (list in the appendix). You can see that some networks are almost completely small cap funded (SubGame Gamma and Darwinia). On the other hand, large cap investors (>5,000 DOT) make up 68% of Moonbeam’s crowdloan (by value), 62% of Parallel Finance’s, and 58% of Clover’s.
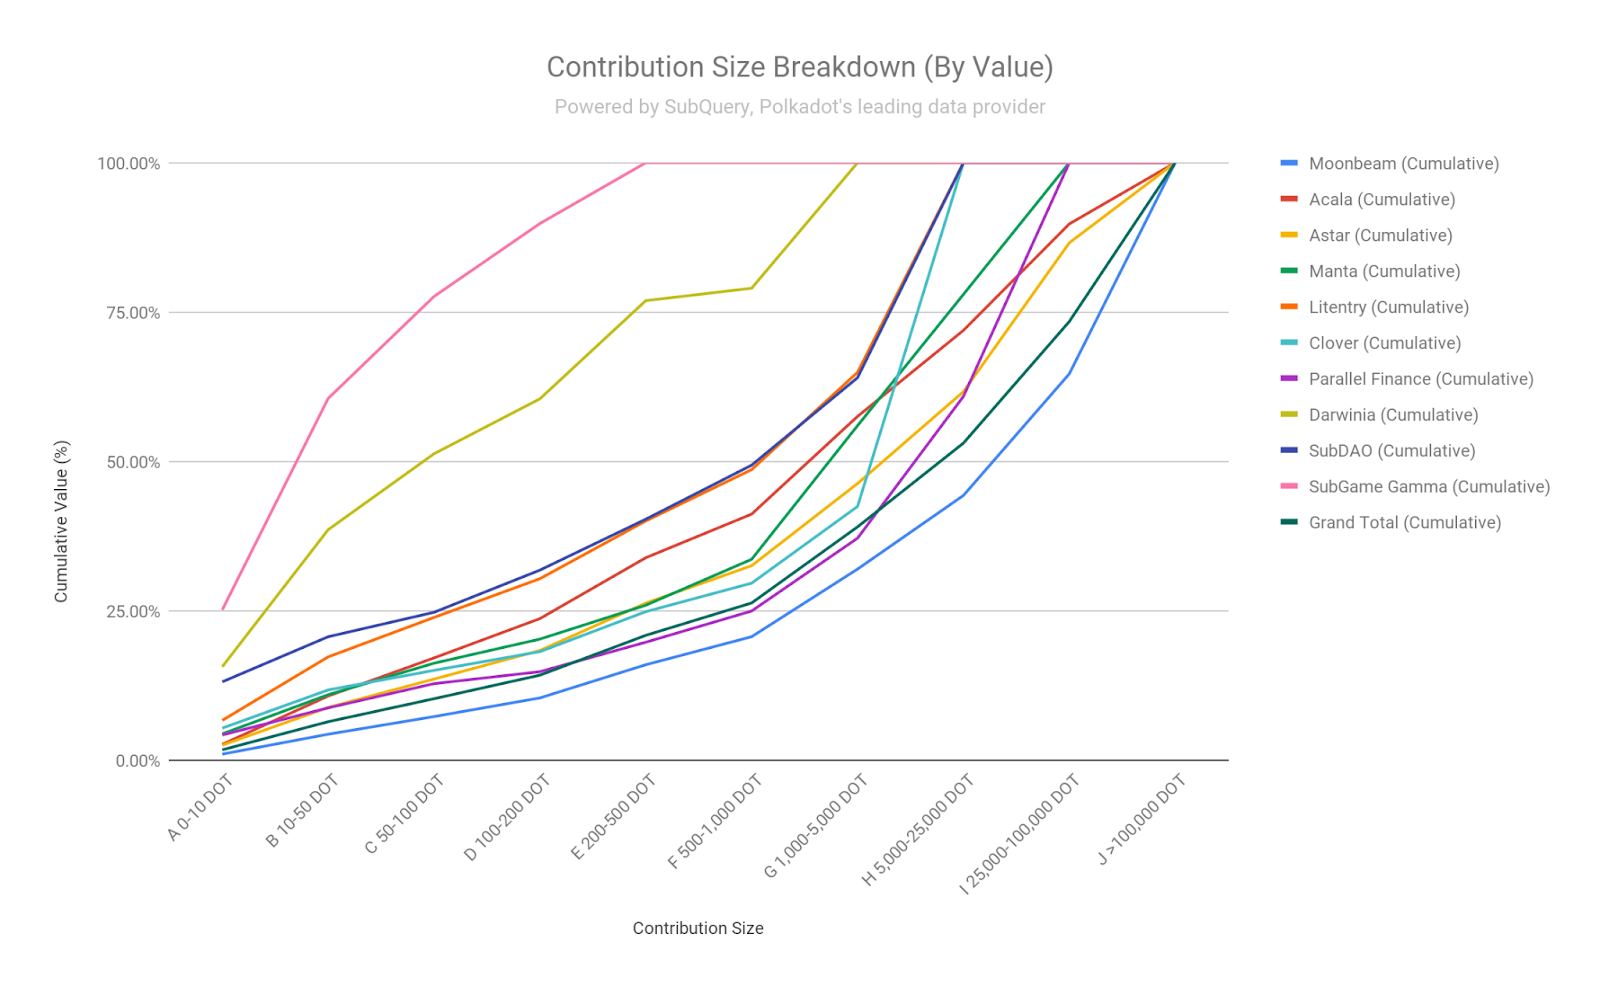
Obviously we are here to look at Moonbeam and Acala, and here we can see that Acala has more small cap funding than Moonbeam, with 33% of Acala’s contributions being less than 1,000 DOT (USD$40,470) compared to 21% of Moonbeam’s.
Note, the previous insights around “the people’s network” have been taken after excluding known contributors that aggregate other contributions into one. SubQuery has only identified a small number, there will certainly be aggregators that we have missed that may be material to the data shared here
So where are people contributing from? SubQuery has identified that Acala’s LCDOT was a runaway success, and resulted in almost 28% of all contributions. With over 24 million DOT (US$971 million) contributed directly to Acala, this auction would likely have gone another way without it.
Additionally, Binance proved to be a popular participation pathway with 27% of contributions across all most participants. We round out the significance contribution methods with Parallel Finance at 11% of contributions, and Kraken at 7%. Centralised exchanges are still clearly a preferred method of participation.
About SubQuery Network
SubQuery is Polkadot’s leading data provider, supporting an indexing & querying layer between Layer-1 blockchains (Polkadot) and decentralized applications. SubQuery’s data service is being used by most of the Polkadot and Kusama crowdloan and parachain auction websites live today.
SubQuery’s protocol abstracts away blockchain data idiosyncrasies with the SubQuery SDK, allowing developers to focus on deploying their core product without needlessly wasting efforts on custom backend technologies.
Linktree | Website | Discord | Telegram | Twitter | Matrix | LinkedIn | YouTube
Appendix
All USD prices are quoted at the price at the 1st Auctions’s close = USD$40.47
All data is from the start of the Polkadot Crowdloans to the completion of the first auction on 18th November 11.57AM UTC (block 7,756,107)
Excluded Crowdloan Sites