Welcome to the next instalment of the SubQuery Mastery Series, where we help you navigate the SubQuery Network and ensure you maximise potential rewards. If you’re reading this article you might be one of our trusted Node Operators or thinking about becoming one.
Recently, the community-owned application SQTScan was launched to help expert users such as Node Operators and Delegators to gain a deeper understanding of historical rewards on the SubQuery Network and optimise their participation. Read more about the overview of SQTScan here.
In this article, we will dig deeper into SQTScan and some particularly notable data/information that can support Node Operators in optimising their rewards.
Most Highly Rewarded Projects
Naturally, as a Node Operator, you want to know which project deployments will be the most valuable for you to provide infrastructure for - what projects have the potential to offer you the most rewards.
To help visualise this you can go to the dashboard page of SQTScan and can easily find the top 5 projects that providewith the highest rewards at that time. To go deeper into this data, you can select ‘View All Projects’ and head to the Project Deployments Rewards page. Here you can also sort by any property you want.
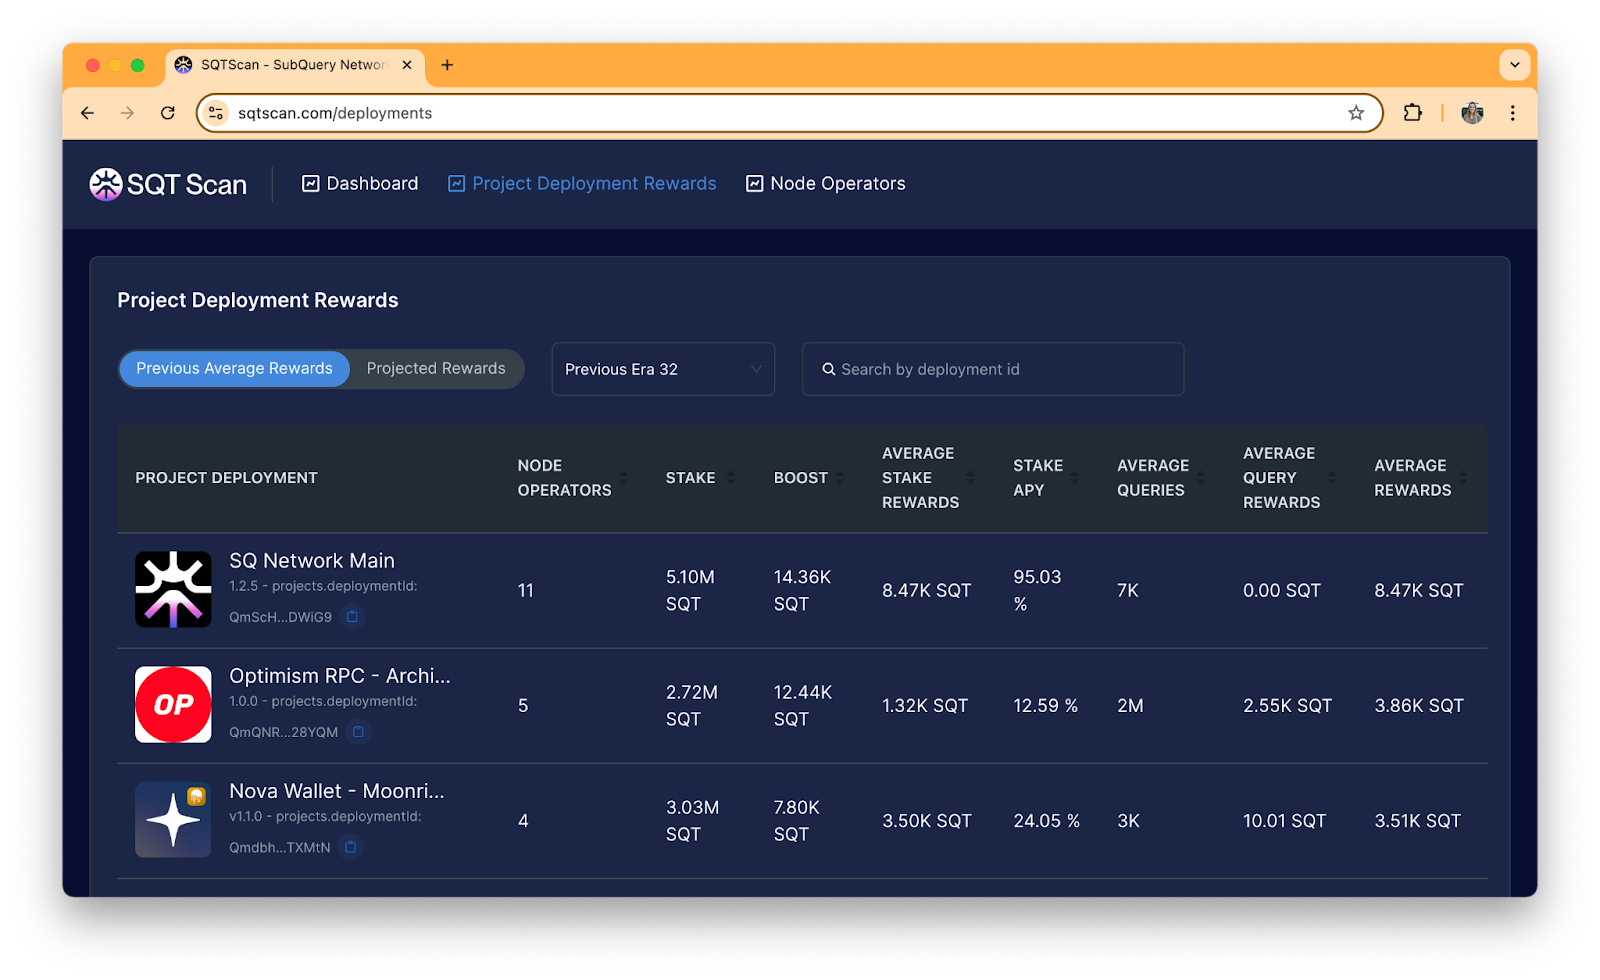
Key metrics
- Average Rewards: Of course this is your ‘bottom line’ metric as it outlines the average rewards produced by this project for each Node Operator.
- Node Operators: Check out the number of Node Operators (NOs) servicing the project. Rewards are shared amongst NOs so if too many jump onto a project then the finite rewards may be split between too many participants.
- Boost: This indicates the demand by Consumers for this project. The higher the ‘boost’ the more demand there is for this project, indicating it is a popular and possibly more stable project for Node Operators to serve.
- Stake APY: Indicates the network inflation rewards distributed to Node Operators simply for running the project. It is expressed in APY, which is an annualised return based on how much each Node Operator stakes.
Previous vs Projected Rewards
Another important thing to look at is the ‘Previous Average Rewards / Projected Rewards’ toggle. It’s good to consider the previous average rewards because this is factual historical data and can give you a good indication of high-performing projects in past Eras.
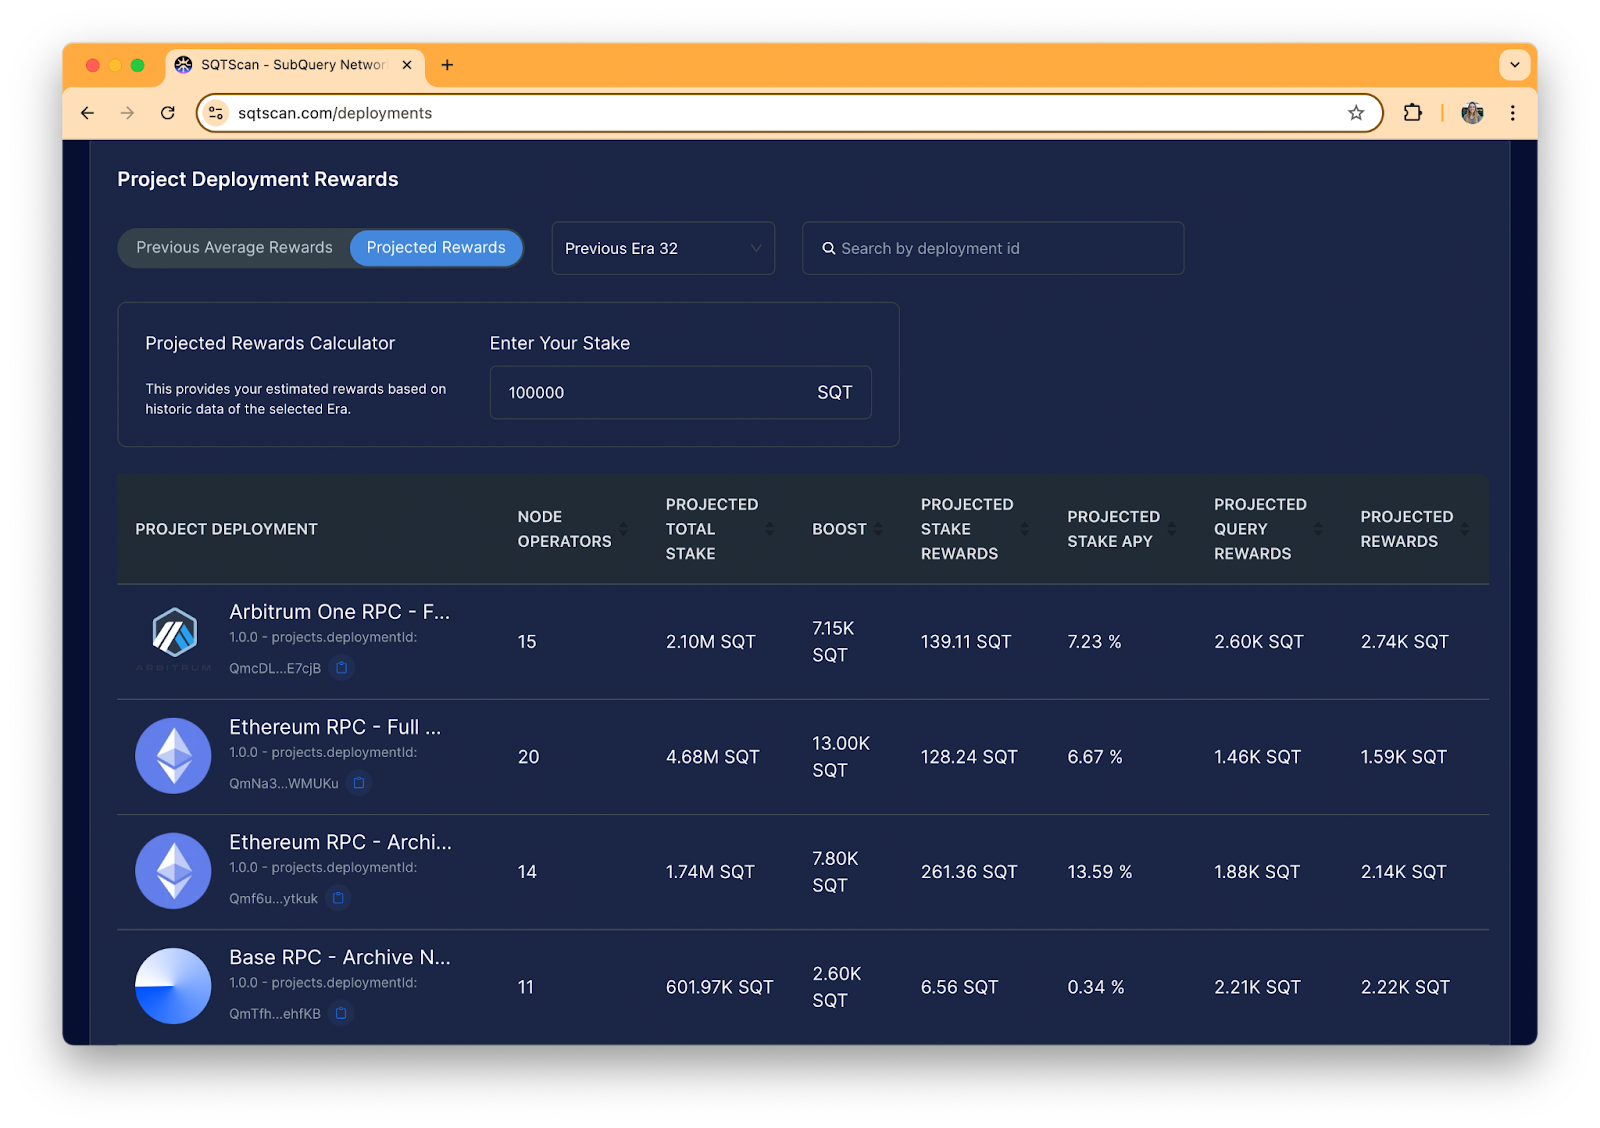
However, you should also switch to the ‘Projected Rewards’ tab and enter a value for how much you might stake. This will calculate what your rewards would have been for this level of stake based on the data from the previous Era - it’s an easy way to model different opportunities to stake.
Highest Performing Node Operators
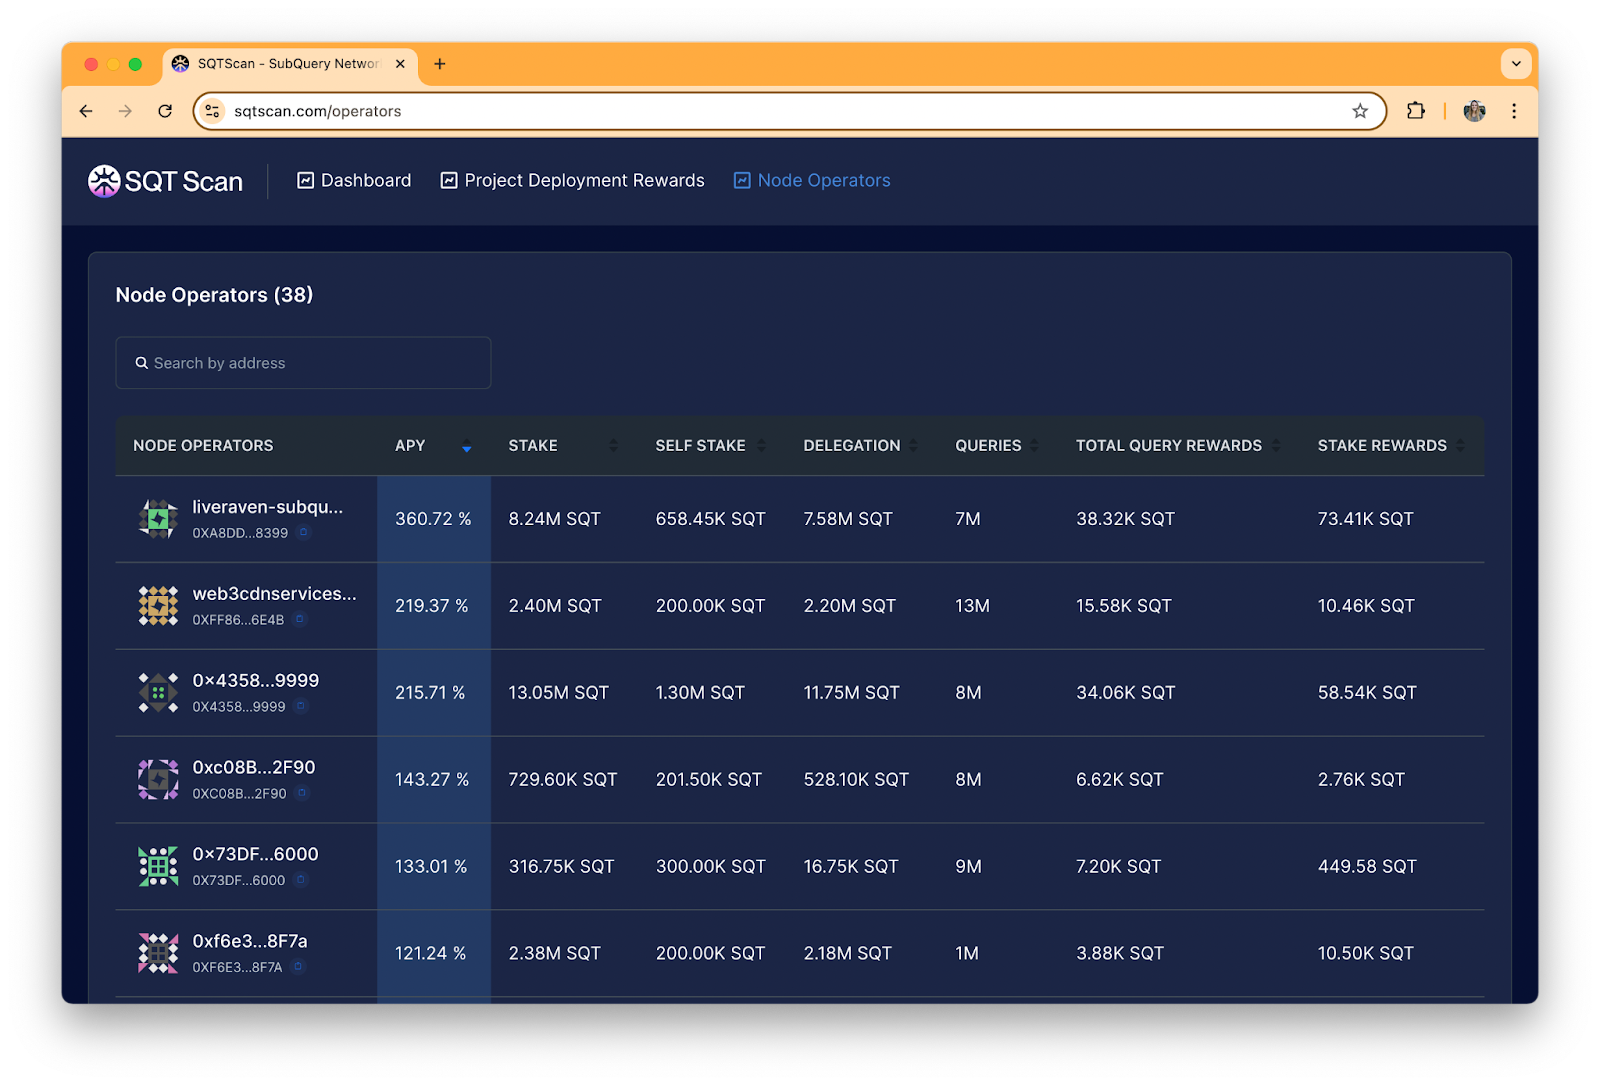
Another excellent feature of SQTScan is the Node Operators page wherein you can review the performance of other Node Operators as well as key information like how much SQT they have staked, how many queries they’re serving and what their overall APY (Annual Percentage Yield) is. This is also extremely useful for delegators who are deciding who to delegate to.
Key metrics
- Stake: this indicates the total amount of SQT staked by the Node Operator (both their self-staked SQT + delegated SQT from delegators). Reviewing this alongside the ‘self-stake’ column is an indication of how popular this Node Operator is amongst Delegators.
- Self Stake: this indicates how much ‘skin in the game’ this Node Operator has and also what portion of their entire stake is coming from themselves instead of their delegator community.
- Queries: this metric is an indicator of work output by the Node Operator. See how many queries they’re serving in order to achieve the amount of rewards they’re receiving.
- APY: here’s your high-level number, the Annual Percentage Yield. APY helps you understand the total amount of SQT rewards they previously received for their participation in a previous Era on an annualised basis. Ultimately Node Operators want to optimise their setup to increase this number and receive higher rewards.
SQTScan for Delegators
SQTScan is not just for Node Operators, Delegators can also find it very useful to maximise their own rewards. For example, Delegators can use SQTScan to view the rewards provided by different up and coming projects and then find the Node Operators that are dominating the rewards on that given project. They can use the same application to compare and understand the rewards that the Node Operators are receiving to help themselves understand where might be the best delegation opportunity.
Want to Contribute to SQTScan?
SQTScan is a community-owned application, and some major Node Operators are already contributing to the application and making improvements. If you would like to add your support, suggest improvements or new features, or even contribute code, it is welcomed!
You can find the GitHub for SQTScan here: https://github.com/HuberTRoy/subquery-sqtscan
Becoming a Node Operator
With tools like SQTScan to help, our Node Operators have the information they need to optimise their setup on the SubQuery Network and ensure they’re receiving max APY (currently ~70% for Node Operators).
If you have any questions or want to come onboard as a Node Operator then join our Discord and head to the SubQuery Network section. Here you can chat to all our existing Node Operators or one of the team directly.
We’d love to have you onboard!
About SubQuery
SubQuery Network is innovating web3 infrastructure with tools that empower builders to decentralise the future. Our fast, flexible, and open data indexer supercharges dApps on over 200 networks, enabling a user-focused web3 world. Soon, our Data Node will provide breakthroughs in the RPC industry, and deliver decentralisation without compromise. We pioneer the web3 revolution for visionaries and forward-thinkers. We’re not just a company — we’re a movement driving an inclusive and decentralised web3 era. Let’s shape the future of web3, together.
Linktree | Website | Discord | Telegram | Twitter | Blog | Medium | LinkedIn | YouTube